Photo illustration: Facebook Post Metrics vs Story Metrics
Facebook post metrics measure engagement through likes, comments, shares, and reach, reflecting audience interaction on static content. Story metrics track views, replies, exits, and swipe-ups, providing insights into ephemeral content performance and viewer retention. Discover deeper differences between Facebook post and story metrics in this article.
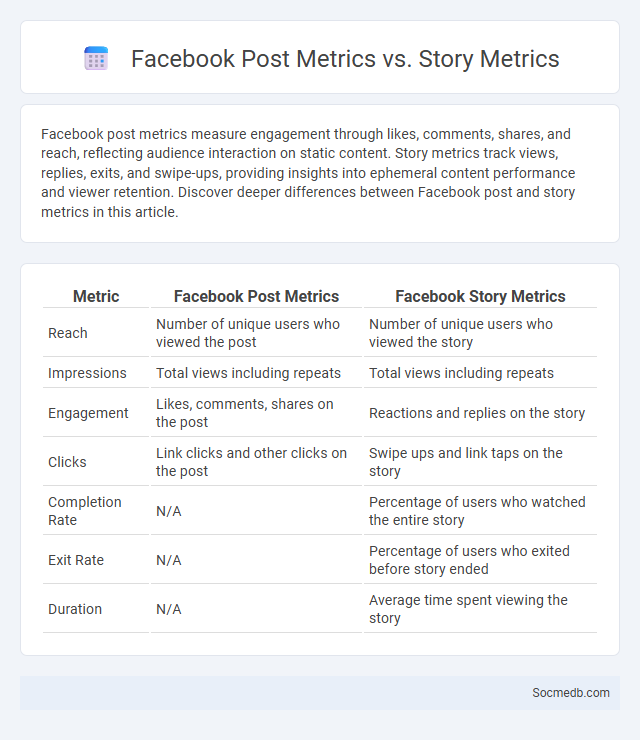
Table of Comparison
| Metric | Facebook Post Metrics | Facebook Story Metrics |
|---|---|---|
| Reach | Number of unique users who viewed the post | Number of unique users who viewed the story |
| Impressions | Total views including repeats | Total views including repeats |
| Engagement | Likes, comments, shares on the post | Reactions and replies on the story |
| Clicks | Link clicks and other clicks on the post | Swipe ups and link taps on the story |
| Completion Rate | N/A | Percentage of users who watched the entire story |
| Exit Rate | N/A | Percentage of users who exited before story ended |
| Duration | N/A | Average time spent viewing the story |
Understanding Facebook Post Metrics
Facebook post metrics reveal valuable insights into audience engagement, including likes, shares, comments, and reach, which collectively measure your content's performance. Analyzing these metrics helps you identify what resonates with your target demographic, improving your content strategy. Monitoring post metrics regularly ensures you optimize your Facebook presence to maximize visibility and interaction.
Key Metrics to Track in Facebook Stories
Tracking key metrics in Facebook Stories is crucial for understanding your audience engagement and content performance. Focus on metrics such as Story Views, Completion Rate, and Swipe-Ups to gauge how effectively your Stories capture attention and drive user action. By monitoring these insights, You can optimize your content strategy to increase reach and interaction.
Fundamental Differences Between Posts and Story Metrics
Posts on social media offer permanent visibility and detailed engagement analytics such as likes, comments, and shares, allowing for comprehensive performance tracking over time. Stories provide ephemeral content that disappears after 24 hours, focusing on impressions, swipe-ups, and exit rates to gauge immediate audience interaction. Understanding these fundamental differences in metrics enables you to tailor your content strategy effectively and maximize engagement across platforms.
Engagement Patterns: Posts vs. Stories
Posts on social media typically generate higher long-term engagement through likes, comments, and shares, making them ideal for sustained audience interaction. Stories drive immediate, ephemeral engagement with features like polls, questions, and quick reactions, capitalizing on their 24-hour visibility to boost real-time participation. Brands leveraging both formats can maximize reach by combining the permanence of posts with the interactive immediacy of stories.
Reach and Impressions: Posts Compared to Stories
Social media reach and impressions vary significantly between posts and stories, with posts generally generating longer-lasting visibility due to their permanence on your profile. Stories offer more immediate, high-engagement impressions through ephemeral content that disappears after 24 hours, prompting quick viewer interaction. Understanding these differences allows you to strategically balance content types for maximum audience impact.
Analyzing Clicks and Interactions Across Formats
Analyzing clicks and interactions across social media formats reveals how different content types engage your audience and drive traffic. Metrics such as click-through rate (CTR), engagement rate, and interaction depth provide insights into which formats--videos, images, or stories--resonate most effectively. Utilizing these data points helps optimize your content strategy for maximum reach and user engagement.
The Role of Reporting in Facebook Analytics
Reporting in Facebook Analytics plays a crucial role in tracking user engagement, conversion rates, and ad performance across different demographics. Detailed reports enable marketers to identify trends, optimize campaigns for higher ROI, and make data-driven decisions based on metrics such as click-through rates, bounce rates, and audience retention. Real-time insights offer the ability to adjust marketing strategies swiftly, improving overall social media effectiveness and customer targeting on the Facebook platform.
Choosing the Right Metrics for Your Goals
Selecting the right social media metrics involves aligning key performance indicators (KPIs) with specific business objectives such as brand awareness, engagement, or conversion rates. Metrics like reach and impressions are essential for measuring audience growth, while click-through rates (CTR) and conversion tracking provide insights into user actions and return on investment (ROI). Regular analysis of these data points enables strategic adjustments, maximizing the effectiveness of social media campaigns and achieving targeted goals.
Tools for Effective Facebook Reporting
Advanced tools like Facebook Insights provide comprehensive analytics on user engagement, reach, and demographics, enabling precise measurement of campaign performance. Third-party platforms such as Hootsuite and Sprout Social offer customizable reports that integrate Facebook data with other social media metrics for holistic analysis. Utilizing these tools improves decision-making by highlighting key trends, optimizing content strategy, and ensuring alignment with business objectives.
Best Practices for Comparing and Reporting Facebook Metrics
Evaluating Facebook metrics effectively requires focusing on key performance indicators such as engagement rate, reach, and click-through rate to gain insights into audience behavior and content effectiveness. Consistently comparing metrics across different time frames and campaigns helps identify trends and optimize strategies for improved ROI. Accurate reporting involves using tools like Facebook Analytics and third-party software to visualize data clearly and support decision-making with actionable insights.