Photo illustration: Playback Locations vs Traffic Sources
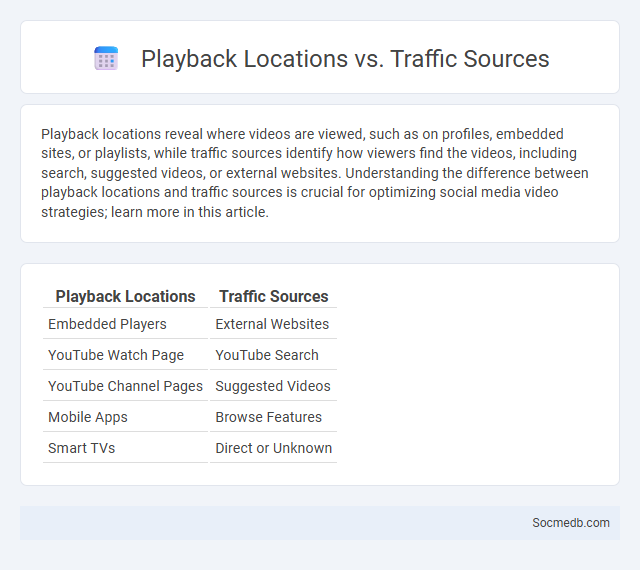
Playback locations reveal where videos are viewed, such as on profiles, embedded sites, or playlists, while traffic sources identify how viewers find the videos, including search, suggested videos, or external websites. Understanding the difference between playback locations and traffic sources is crucial for optimizing social media video strategies; learn more in this article.
Table of Comparison
| Playback Locations | Traffic Sources |
|---|---|
| Embedded Players | External Websites |
| YouTube Watch Page | YouTube Search |
| YouTube Channel Pages | Suggested Videos |
| Mobile Apps | Browse Features |
| Smart TVs | Direct or Unknown |
Understanding Playback Locations: Definition and Examples
Playback locations refer to the specific platforms or environments where social media content is consumed, such as Instagram Stories, Facebook feeds, YouTube watch pages, or TikTok For You pages. Understanding playback locations enables marketers to optimize content format, timing, and messaging to align with user behavior on each platform. Examples include targeted video ads on Instagram Reels, carousel posts in Facebook newsfeeds, and short-form videos on TikTok, maximizing engagement by leveraging platform-specific features and consumption patterns.
What are Traffic Sources in Video Analytics?
Traffic sources in video analytics refer to the origin points that drive viewers to the video content, such as social media platforms, search engines, direct links, and embedded videos on websites. Analyzing traffic sources helps marketers understand which channels generate the most engagement and optimize their distribution strategy accordingly. Key metrics include referral URLs, demographic data, and viewer behavior from each source, enabling targeted content promotion and increased video reach.
The Role of the Analytics Dashboard in Content Strategy
The analytics dashboard plays a pivotal role in social media content strategy by providing real-time data on audience engagement, reach, and demographics. Key metrics such as click-through rates, post shares, and follower growth enable marketers to tailor content for maximum impact and optimize posting schedules. Utilizing these insights drives informed decisions that enhance brand visibility and boost overall campaign effectiveness.
Comparing Playback Locations and Traffic Sources
Comparing playback locations on social media reveals user engagement patterns across devices, with mobile phones dominating over desktops and tablets, accounting for approximately 70% of video views. Traffic sources analysis shows that organic searches and direct links contribute significantly to content discovery, while paid advertisements and social media shares boost rapid audience growth. Understanding these metrics enables marketers to optimize content delivery and targeting strategies for enhanced reach and user interaction.
How Playback Locations Affect Viewer Behavior
Playback locations on social media platforms significantly influence viewer behavior by impacting engagement rates and content visibility. Users tend to interact more with videos played within the native app environment compared to external sites, leading to longer watch times and higher retention. Understanding where your audience views content can help optimize distribution strategies to maximize reach and interaction.
Leveraging Traffic Sources for Audience Growth
Leveraging traffic sources such as search engines, social media platforms, and referral websites can significantly boost your audience growth by targeting relevant and engaged users. Utilizing analytics to identify high-performing sources allows you to optimize content distribution, driving more qualified traffic to your profile or website. You can maximize reach and conversion rates by integrating multi-channel strategies tailored to your audience's behavior and preferences.
Analytics Dashboard Features: Key Metrics to Monitor
Social media analytics dashboards provide critical insights by tracking key metrics such as engagement rate, follower growth, reach, and click-through rate. Monitoring sentiment analysis and audience demographics helps tailor content strategies for improved user interaction and brand loyalty. Real-time data visualization and customizable reports enable businesses to measure campaign effectiveness and optimize social media performance efficiently.
Interpreting Data from Playback Locations vs Traffic Sources
Analyzing playback locations reveals where users physically engage with content, highlighting popular devices and platforms for video consumption. Traffic sources data identifies the origins of user visits, such as direct visits, social media referrals, or search engines, allowing marketers to target and optimize campaigns effectively. Comparing playback locations and traffic sources provides comprehensive insights into audience behavior, enabling tailored content distribution strategies that maximize reach and engagement.
Optimizing Content Performance using Dashboard Insights
Dashboard insights provide critical analytics to optimize your social media content performance by revealing audience engagement patterns, peak activity times, and preferred content types. Utilizing these data-driven metrics allows for precise adjustments in posting schedules, content formats, and messaging strategies to increase reach and interaction. Leveraging your dashboard insights ensures that your social media efforts are aligned with audience preferences, maximizing impact and growth.
Best Practices for Integrating Playback Locations and Traffic Data
Integrating playback locations and traffic data into your social media strategy enhances audience targeting and content performance analysis. Use geotagging and location-based analytics to identify high-engagement areas and tailor posts accordingly. Monitoring traffic sources alongside playback metrics helps you optimize ad placements and improve user experience for Your campaigns.