Photo illustration: Facebook CTR vs Instagram CTR
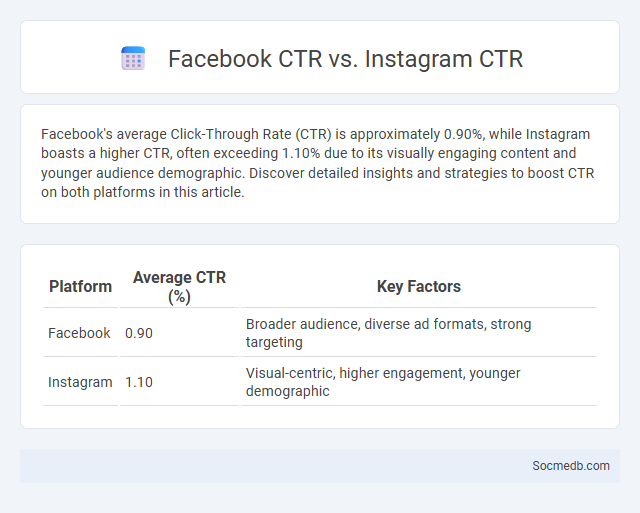
Facebook's average Click-Through Rate (CTR) is approximately 0.90%, while Instagram boasts a higher CTR, often exceeding 1.10% due to its visually engaging content and younger audience demographic. Discover detailed insights and strategies to boost CTR on both platforms in this article.
Table of Comparison
| Platform | Average CTR (%) | Key Factors |
|---|---|---|
| 0.90 | Broader audience, diverse ad formats, strong targeting | |
| 1.10 | Visual-centric, higher engagement, younger demographic |
Introduction to Click-Through Rate (CTR)
Click-Through Rate (CTR) measures the effectiveness of your social media campaigns by calculating the percentage of users who click on a specific link after seeing it. This key metric helps you understand user engagement and the relevance of your content to your target audience. Optimizing CTR leads to higher traffic, better conversion rates, and improved return on investment for your social media efforts.
Understanding Facebook CTR
Facebook click-through rate (CTR) measures the percentage of users who click on a link within a Facebook ad or post, indicating engagement and ad effectiveness. Analyzing CTR helps marketers optimize ad targeting, creative content, and bidding strategies to improve campaign performance. Higher CTRs often correlate with increased traffic, better conversion rates, and lower cost-per-click (CPC) in Facebook advertising campaigns.
Exploring Instagram CTR
Instagram click-through rate (CTR) serves as a vital metric for measuring user engagement by tracking how often viewers click on links within posts, stories, or ads. High CTR on Instagram indicates effective content targeting and resonates with audiences, driving traffic to websites or product pages. Optimizing captions, using compelling call-to-actions, and leveraging Instagram's interactive features significantly boost CTR performance.
Key Differences Between Facebook and Instagram CTR
Facebook's click-through rate (CTR) typically benefits from its extensive user base and diverse ad formats targeting a wide demographic, whereas Instagram's CTR excels with visually engaging content appealing mainly to younger audiences. Facebook ads often leverage detailed user data for precise targeting, leading to higher CTRs in industries like finance and retail, while Instagram's CTR is stronger in fashion, beauty, and lifestyle sectors due to its focus on imagery and influencer marketing. The difference in user interaction patterns and platform algorithms fundamentally shapes the effectiveness and CTR outcomes in advertising campaigns on these social media platforms.
Factors Influencing CTR on Facebook and Instagram
Understanding factors influencing click-through rate (CTR) on Facebook and Instagram involves analyzing audience targeting, ad placement, and creative quality. Precise audience segmentation ensures your ads reach relevant users most likely to engage, while optimizing placements in feeds or stories maximizes visibility. Your ad's visual appeal, compelling call-to-action, and concise messaging significantly drive higher CTR in social media campaigns.
Industry Benchmarks for CTR: Facebook vs Instagram
Facebook's average click-through rate (CTR) across industries typically ranges from 0.90% to 1.60%, while Instagram often exhibits higher engagement with CTRs averaging between 1.20% and 1.85%. Industries such as retail, fashion, and technology tend to perform better on Instagram due to its visual-centric platform, boosting CTRs beyond Facebook's averages. Marketers leveraging Instagram's Stories and shopping features experience increased CTRs, making it a preferred channel for campaigns focusing on direct user interaction and conversions.
Ad Formats and Their Impact on CTR
Social media platforms offer diverse ad formats such as carousel ads, video ads, and sponsored posts, each influencing click-through rates (CTR) differently. Carousel ads typically yield higher CTR by providing interactive content, while video ads engage users visually, enhancing brand recall and boosting clicks. Sponsored posts blend seamlessly into users' feeds, increasing authenticity and trust, which often results in improved CTR performance.
Audience Engagement Patterns Across Platforms
Audience engagement patterns vary significantly across social media platforms, with Instagram showing high interaction rates through visual content and Stories, while Twitter drives real-time conversations centered on trending topics and hashtags. Facebook maintains strong community engagement via groups and personalized content feeds, enhancing user retention and interaction frequency. TikTok's algorithm promotes viral short-form videos, resulting in rapid audience growth and high engagement metrics for content creators targeting younger demographics.
Strategies to Improve CTR on Facebook and Instagram
Optimizing your Facebook and Instagram campaigns involves targeting the right audience with engaging visuals and compelling calls-to-action to boost click-through rates (CTR). Leveraging A/B testing for ad creatives and analyzing peak engagement times help refine your strategy and maximize your ad spend efficiency. You can increase CTR by integrating interactive content such as polls or stories and ensuring your messaging aligns with audience interests and platform trends.
Choosing the Right Platform for Maximum CTR
Selecting the right social media platform is crucial for maximizing click-through rates (CTR), with data showing platforms like Instagram and TikTok generate higher engagement for visual content, while LinkedIn attracts professional audiences with a higher CTR on B2B campaigns. Analyzing audience demographics and behavior on each platform allows marketers to tailor content that resonates and drives action. Investing in platform-specific strategies and leveraging tools like Facebook Ads Manager or LinkedIn Campaign Manager optimizes ad placement and targeting, boosting overall CTR performance.