Photo illustration: Power BI vs Tableau
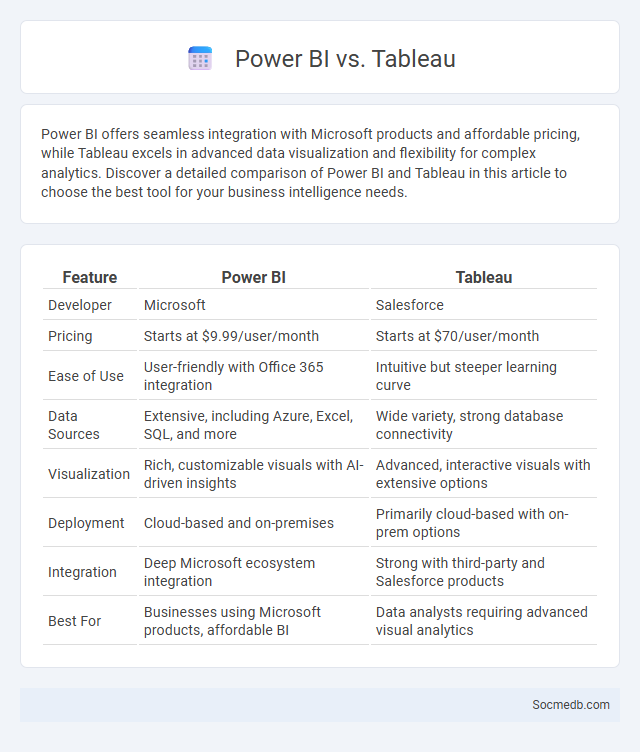
Power BI offers seamless integration with Microsoft products and affordable pricing, while Tableau excels in advanced data visualization and flexibility for complex analytics. Discover a detailed comparison of Power BI and Tableau in this article to choose the best tool for your business intelligence needs.
Table of Comparison
| Feature | Power BI | Tableau |
|---|---|---|
| Developer | Microsoft | Salesforce |
| Pricing | Starts at $9.99/user/month | Starts at $70/user/month |
| Ease of Use | User-friendly with Office 365 integration | Intuitive but steeper learning curve |
| Data Sources | Extensive, including Azure, Excel, SQL, and more | Wide variety, strong database connectivity |
| Visualization | Rich, customizable visuals with AI-driven insights | Advanced, interactive visuals with extensive options |
| Deployment | Cloud-based and on-premises | Primarily cloud-based with on-prem options |
| Integration | Deep Microsoft ecosystem integration | Strong with third-party and Salesforce products |
| Best For | Businesses using Microsoft products, affordable BI | Data analysts requiring advanced visual analytics |
Introduction to Power BI, Tableau, and Skills Assessment
Power BI and Tableau are leading business intelligence tools used for data visualization and analytics in social media performance tracking. Mastery of these platforms enables users to create interactive dashboards that illustrate user engagement, sentiment analysis, and campaign effectiveness. Skills assessment in Power BI and Tableau involves evaluating proficiency in data modeling, DAX formulas, and custom visualization techniques essential for optimizing social media strategies.
Overview of Power BI: Features and Benefits
Power BI offers robust data visualization tools that transform raw social media metrics into actionable insights, enhancing your ability to track engagement, audience demographics, and campaign performance. Its seamless integration with various data sources and real-time analytics empowers your marketing strategies with timely, data-driven decisions. Utilizing Power BI's interactive dashboards and customizable reports maximizes your social media ROI by pinpointing trends and optimizing content effectiveness.
Tableau: Key Features and Advantages
Tableau offers powerful data visualization tools that transform your social media metrics into clear, interactive dashboards for better insights. Its ability to connect seamlessly with various social media platforms allows you to analyze engagement, follower growth, and campaign performance in real-time. You gain a competitive edge by leveraging Tableau's advanced analytics and customizable reports to optimize social media strategies efficiently.
Comparing Power BI and Tableau: Core Differences
Power BI offers seamless integration with Microsoft products and pricing advantages suitable for businesses using the Microsoft ecosystem, while Tableau excels in advanced data visualization capabilities with a user-friendly interface favored by data analysts. Tableau supports a wider variety of data connectors and provides more customizable dashboards, ideal for organizations requiring in-depth visual storytelling. Power BI emphasizes real-time data updates and AI-powered analytics, making it a strong choice for enterprises prioritizing dynamic reporting and automated insights.
Skills Assessment: Definition and Importance in Data Analytics
Skills assessment in data analytics evaluates your proficiency in key areas such as data mining, statistical analysis, and machine learning techniques. This process identifies strengths and gaps, enabling targeted skill development critical for handling large datasets and deriving actionable insights. Mastering these assessments enhances your social media analytics capabilities, driving improved decision-making and strategy optimization.
Power BI Skills Assessment: Essential Competencies
Power BI skills assessment evaluates essential competencies such as data visualization, DAX formulas proficiency, and dashboard creation to enable effective business intelligence analysis. Mastery in Power Query for data transformation and integration is critical for handling diverse data sources in real-time social media analytics. Proficient Power BI users drive actionable insights by combining social media metrics with advanced modeling techniques and interactive report design.
Tableau Skills Assessment: Critical Skill Areas
Mastering Tableau skills assessment requires proficiency in data visualization principles, dashboard creation, and advanced calculations such as LOD expressions and table calculations. Understanding data connectivity, preparation techniques, and performance optimization are critical skill areas that directly impact your efficiency and output quality. By honing these competencies, you enhance your ability to transform raw social media data into actionable insights that drive informed decision-making.
Tools and Methods for Assessing BI Skills
Effective tools for assessing business intelligence (BI) skills on social media include platforms like LinkedIn Skills Assessments and Facebook Analytics that provide insights into data interpretation and reporting abilities. Methods such as analyzing engagement metrics, sentiment analysis, and social media data visualization tests help evaluate proficiency in data-driven decision-making. Incorporating practical assignments using tools like Tableau, Power BI, and Google Data Studio further enhances the measurement of BI competencies in real-world social media scenarios.
Choosing Between Power BI and Tableau Based on Skill Sets
Choosing between Power BI and Tableau depends largely on your existing skill sets and data analysis needs. Power BI integrates seamlessly with Microsoft Office products and is ideal for users familiar with Excel and other Microsoft services, offering robust data modeling and DAX language capabilities. Tableau excels in advanced data visualization and interactive dashboard creation, making it the preferred choice for professionals with experience in complex analytical storytelling and diverse data sources.
Conclusion: Which BI Tool Aligns with Your Team’s Skills?
Choosing the right BI tool depends on your team's technical expertise, data analysis needs, and collaboration preferences. User-friendly platforms like Tableau or Power BI offer intuitive interfaces and robust social media analytics capabilities suitable for teams with varied skill levels. Assessing your team's proficiency ensures you select a BI solution that maximizes insights and drives impactful social media strategies.