Photo illustration: Impressions Click-Through Rate vs Views
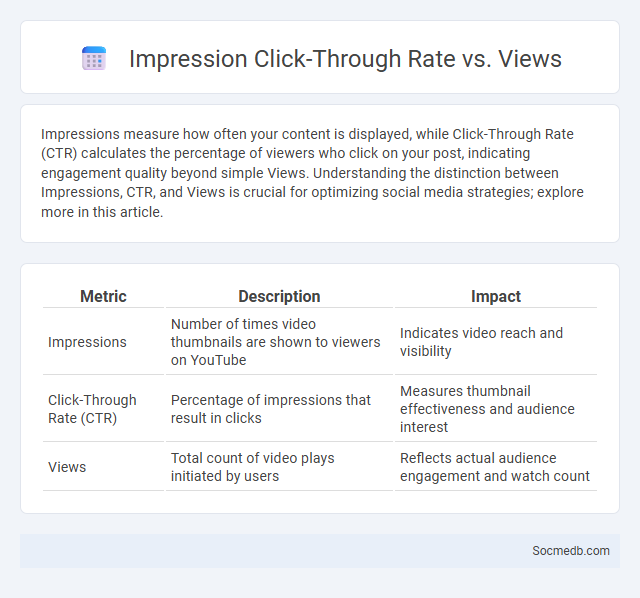
Impressions measure how often your content is displayed, while Click-Through Rate (CTR) calculates the percentage of viewers who click on your post, indicating engagement quality beyond simple Views. Understanding the distinction between Impressions, CTR, and Views is crucial for optimizing social media strategies; explore more in this article.
Table of Comparison
| Metric | Description | Impact |
|---|---|---|
| Impressions | Number of times video thumbnails are shown to viewers on YouTube | Indicates video reach and visibility |
| Click-Through Rate (CTR) | Percentage of impressions that result in clicks | Measures thumbnail effectiveness and audience interest |
| Views | Total count of video plays initiated by users | Reflects actual audience engagement and watch count |
Understanding Impressions: What They Really Mean
Impressions on social media represent the total number of times a post or ad is displayed to users, highlighting the potential reach rather than unique viewers. This metric helps gauge content visibility and brand awareness but does not measure user engagement or interaction. Understanding impressions alongside metrics like reach and engagement rate offers a clearer picture of campaign performance and audience impact.
Click-Through Rate (CTR): Measuring Engagement
Click-Through Rate (CTR) is a critical metric for evaluating your social media engagement, reflecting the percentage of users who click on a link after seeing your content. High CTR indicates effective targeting and compelling calls-to-action, driving traffic to your website or landing pages. Optimizing headlines, visuals, and posting times can significantly boost your CTR, enhancing overall campaign performance.
Views Explained: Quantity vs. Quality
Social media views represent the quantity of times content is seen, but quality views emphasize genuine engagement and user interaction. High-quality views often translate into meaningful brand connections, higher conversion rates, and sustained audience loyalty. Businesses optimizing for view quality can achieve deeper insights and better ROI than those focusing solely on view counts.
Impressions vs. Views: Key Differences
Impressions measure how many times your content is displayed on a screen, regardless of interaction, while views count the actual number of times your video or post is watched or engaged with. Impressions provide insight into the potential reach of your social media campaign, whereas views indicate direct audience engagement and content effectiveness. Understanding the distinction between impressions and views allows you to better analyze your social media performance and optimize your content strategy.
CTR vs. Views: Which Matters More?
Click-through rate (CTR) measures the percentage of users who engage with your social media content by clicking on links, providing a direct indicator of audience interest and potential conversion. Views indicate the total number of times your content is displayed, offering a broad measure of reach but not necessarily engagement or impact. Your social media strategy should prioritize CTR to maximize meaningful interactions and drive targeted traffic, rather than focusing solely on views.
Analytics Dashboards: Visualizing Performance Data
Analytics dashboards on social media platforms provide real-time visualization of key performance metrics such as engagement rates, follower growth, and content reach. These dashboards enable marketers to track campaign effectiveness through interactive charts and graphs, facilitating data-driven decisions. By consolidating metrics like impressions, click-through rates, and audience demographics, analytics dashboards optimize social media strategy and improve ROI.
How Dashboards Track Impressions, Views, and CTR
Social media dashboards aggregate real-time data on impressions, views, and click-through rates (CTR) from platforms like Facebook, Instagram, and Twitter to provide comprehensive performance insights. These tools visualize metrics by tracking user interactions, measuring how many times content appears (impressions), how often it is watched or engaged with (views), and the percentage of users who click on links (CTR). Advanced analytics in dashboards enable marketers to optimize campaigns by correlating engagement patterns with specific content types and audience segments.
Improving Your CTR Using Analytics Insights
Analyzing social media metrics such as click-through rates (CTR), engagement patterns, and audience demographics enables targeted content optimization to boost user interaction. Leveraging tools like Google Analytics and platform-specific insights helps identify high-performing posts and optimal posting times, increasing CTR effectively. Continuous monitoring and data-driven adjustments enhance ad relevance and drive conversions, maximizing social media campaign success.
Common Mistakes Interpreting Dashboard Metrics
Misinterpreting social media dashboard metrics often occurs due to neglecting context and relying solely on vanity metrics such as likes and follower counts, which do not directly translate to engagement or conversions. Overemphasis on raw numbers like impressions without analyzing user behavior patterns leads to inaccurate assessments of campaign effectiveness. Accurate interpretation requires understanding the underlying data trends, correlating metrics with campaign goals, and differentiating between reach, engagement, and conversion metrics for actionable insights.
Choosing the Right Metrics for Success
Choosing the right metrics for success on social media is crucial to accurately measure your campaign's impact and optimize performance. Focus on engagement rates, follower growth, conversion rates, and click-through rates, as these indicators reveal how well your content resonates with your audience. You should prioritize metrics aligned with your specific business goals to ensure data-driven decisions lead to sustained growth and brand awareness.