Photo illustration: Watch Time vs Average View Duration
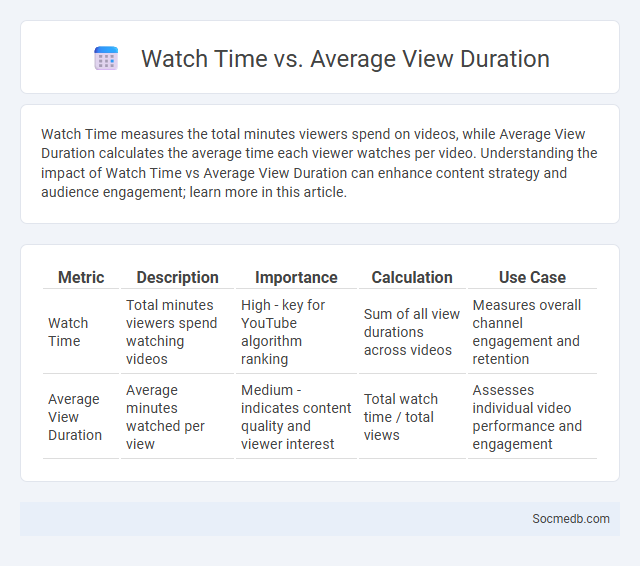
Watch Time measures the total minutes viewers spend on videos, while Average View Duration calculates the average time each viewer watches per video. Understanding the impact of Watch Time vs Average View Duration can enhance content strategy and audience engagement; learn more in this article.
Table of Comparison
| Metric | Description | Importance | Calculation | Use Case |
|---|---|---|---|---|
| Watch Time | Total minutes viewers spend watching videos | High - key for YouTube algorithm ranking | Sum of all view durations across videos | Measures overall channel engagement and retention |
| Average View Duration | Average minutes watched per view | Medium - indicates content quality and viewer interest | Total watch time / total views | Assesses individual video performance and engagement |
Understanding Watch Time: Definition and Importance
Watch time refers to the total amount of time viewers spend watching a video or content on social media platforms, serving as a critical metric for measuring engagement and content quality. High watch time signals strong viewer interest and boosts content visibility through social media algorithms, enhancing organic reach and audience retention. Understanding watch time allows creators and marketers to optimize video length, improve content relevance, and increase overall performance metrics on platforms like YouTube, Instagram, and TikTok.
What is Average View Duration?
Average View Duration (AVD) measures the typical length of time viewers watch a video on social media platforms, providing critical insights into content engagement. This metric helps creators and marketers evaluate the effectiveness of their videos in capturing audience attention and maintaining interest. Higher AVD values indicate strong viewer retention, influencing algorithmic promotion and overall video performance.
Analytics Dashboard Overview
The Analytics Dashboard Overview provides a comprehensive insight into your social media performance, tracking key metrics such as engagement rates, follower growth, and content reach. Real-time data visualization tools enable you to identify trends and optimize posting strategies for maximum impact. Using this dashboard, your brand can make data-driven decisions to enhance audience interaction and increase overall social media effectiveness.
Key Differences Between Watch Time and Average View Duration
Watch Time measures the total amount of time viewers spend watching your social media videos, highlighting overall engagement and popularity. Average View Duration calculates the mean time viewers watch each video, providing insights into the content's ability to maintain your audience's attention. Understanding these key differences helps you optimize video length and content strategy to boost viewer retention and platform performance.
Tracking Metrics Using the Analytics Dashboard
Tracking metrics using the analytics dashboard provides valuable insights into audience engagement, content performance, and growth trends on your social media platforms. By monitoring data such as reach, impressions, click-through rates, and follower demographics, you can tailor your strategy to maximize impact and ROI. Your ability to analyze these metrics effectively allows for data-driven decisions that enhance brand visibility and user interaction.
How Watch Time Impacts Channel Performance
Watch time is a critical metric that directly influences your social media channel's performance by signaling viewer engagement to platform algorithms. Higher watch time increases the likelihood of your content being promoted through recommendations, boosting visibility and subscriber growth. Focusing on creating engaging, longer videos encourages viewers to spend more time on your channel, improving overall rankings and reach.
Improving Average View Duration: Best Practices
Improving average view duration on social media requires engaging content that captures attention within the first few seconds, using compelling visuals and clear messaging tailored to the target audience. Implementing storytelling techniques, such as narrative arcs and emotional hooks, encourages viewers to watch longer and increases retention rates. Optimizing video length for platform algorithms and incorporating interactive elements like polls or captions further boosts viewer engagement and session duration.
Analyzing Data on the Analytics Dashboard
Analyzing data on the social media analytics dashboard reveals key insights into audience engagement, reach, and content performance. By monitoring metrics such as impressions, click-through rates, and follower growth, you can tailor your strategy for maximum impact. Your ability to interpret this data drives informed decisions that enhance brand visibility and user interaction.
Strategies to Boost Watch Time and View Duration
To boost watch time and view duration on social media, create engaging content that hooks viewers within the first few seconds and encourages them to stay until the end. Use analytics to identify which videos retain your audience best and replicate those formats while incorporating interactive elements like polls and questions to maintain viewer interest. Optimize video length based on platform-specific trends and tailor your posting schedule to when your audience is most active, enhancing Your overall engagement metrics.
Utilizing Analytics Dashboard for Content Optimization
Utilizing an analytics dashboard allows you to monitor key social media metrics such as engagement rates, audience demographics, and content performance in real-time. By analyzing this data, you can refine your content strategy, identify high-performing posts, and tailor your messaging to better resonate with your target audience. Leveraging these insights maximizes your social media impact and drives sustained growth.