Photo illustration: Facebook Reporting Dashboard vs Excel Reporting
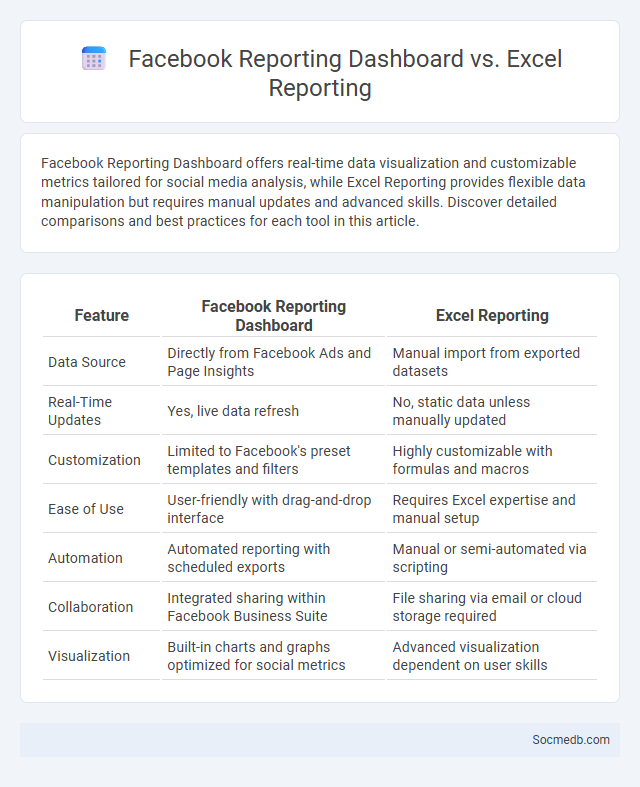
Facebook Reporting Dashboard offers real-time data visualization and customizable metrics tailored for social media analysis, while Excel Reporting provides flexible data manipulation but requires manual updates and advanced skills. Discover detailed comparisons and best practices for each tool in this article.
Table of Comparison
| Feature | Facebook Reporting Dashboard | Excel Reporting |
|---|---|---|
| Data Source | Directly from Facebook Ads and Page Insights | Manual import from exported datasets |
| Real-Time Updates | Yes, live data refresh | No, static data unless manually updated |
| Customization | Limited to Facebook's preset templates and filters | Highly customizable with formulas and macros |
| Ease of Use | User-friendly with drag-and-drop interface | Requires Excel expertise and manual setup |
| Automation | Automated reporting with scheduled exports | Manual or semi-automated via scripting |
| Collaboration | Integrated sharing within Facebook Business Suite | File sharing via email or cloud storage required |
| Visualization | Built-in charts and graphs optimized for social metrics | Advanced visualization dependent on user skills |
Overview of Reporting Tools: Facebook Dashboard, Excel, and General Reporting
Facebook Dashboard offers real-time insights and user-friendly analytics to help you track engagement, reach, and audience demographics efficiently. Excel enables advanced data manipulation, custom reports, and detailed trend analysis through pivot tables and formulas, ideal for in-depth social media performance evaluation. General reporting tools combine automation, visualization, and multi-platform data integration, enhancing the accuracy and comprehensiveness of your social media strategy assessments.
Key Features of Facebook Reporting Dashboard
The Facebook Reporting Dashboard offers comprehensive metrics such as engagement rates, reach, and demographic insights, enabling precise audience targeting and content optimization. Real-time data visualization aids in monitoring campaign performance across various ads and posts, streamlining decision-making processes. Customizable reports and integration with third-party analytics tools enhance in-depth analysis and strategic planning for social media marketing.
Advantages of Using Excel for Reporting
Excel offers powerful data analysis tools and customizable reporting features that enhance social media performance tracking. Its ability to handle large datasets enables efficient organization and visualization of social media metrics such as engagement rates, follower growth, and campaign ROI. Advanced functions like pivot tables and charts provide clear insights, facilitating data-driven decision making for social media strategies.
General Reporting: Definition and Purpose
General reporting in social media involves the systematic collection and presentation of data related to engagement, reach, and audience demographics. This process helps you understand content performance, identify trends, and make informed decisions to optimize future campaigns. Accurate and consistent reporting ensures transparency and accountability in managing social media strategies.
Data Visualization Capabilities Comparison
Data visualization capabilities across social media platforms vary significantly, with Instagram excelling in visual content analytics through image engagement metrics, while Twitter provides robust real-time data visualization for trend tracking and hashtag performance. Facebook offers comprehensive dashboard tools that integrate user demographics and interaction patterns, enabling businesses to derive actionable insights from large datasets. To optimize your social media strategy, leveraging these tailored analytics tools can enhance your content targeting and audience understanding.
Customization and Flexibility in Reporting
Social media platforms offer advanced customization and flexibility in reporting, allowing users to tailor analytics dashboards to specific campaign goals and audience insights. These tools provide granular data segmentation, enabling marketers to track performance metrics such as engagement rates, click-through rates, and demographic behaviors with precision. Enhanced reporting customization supports real-time adjustments and strategic decision-making, optimizing social media marketing outcomes through actionable insights.
Integration with Other Data Sources
Social media platforms seamlessly integrate with various data sources such as customer relationship management (CRM) systems, web analytics, and sales data to provide comprehensive insights into consumer behavior. Leveraging APIs and data connectors allows businesses to unify social media analytics with internal databases, enhancing targeted marketing strategies and personalized user experiences. This integration facilitates real-time data synchronization, enabling more accurate trend analysis and improved decision-making processes.
Ease of Use and User Experience
Social media platforms prioritize intuitive interfaces and seamless navigation to enhance ease of use for all users. Features like customizable dashboards, simple content creation tools, and responsive design improve your overall user experience. Optimized loading times and personalized content feeds keep engagement high and interactions effortless.
Automation and Real-Time Insights
Automation in social media leverages AI-driven tools to schedule posts, manage content, and engage with followers efficiently, significantly reducing manual efforts. Real-time insights provide instant analytics on audience behavior, engagement rates, and trending topics, enabling businesses to adapt strategies promptly. Combining automation with real-time data optimizes campaign performance and enhances targeted marketing outcomes.
Choosing the Right Reporting Solution for Your Business
Choosing the right social media reporting solution for your business ensures accurate tracking of key performance metrics like engagement rates, audience growth, and conversion statistics. Leveraging tools with customizable dashboards and real-time analytics empowers you to make data-driven decisions that align with your marketing objectives. Prioritize solutions compatible with major platforms such as Facebook, Instagram, Twitter, and LinkedIn to maximize your social media insights and ROI.