Photo illustration: Facebook CTR vs Industry Average CTR
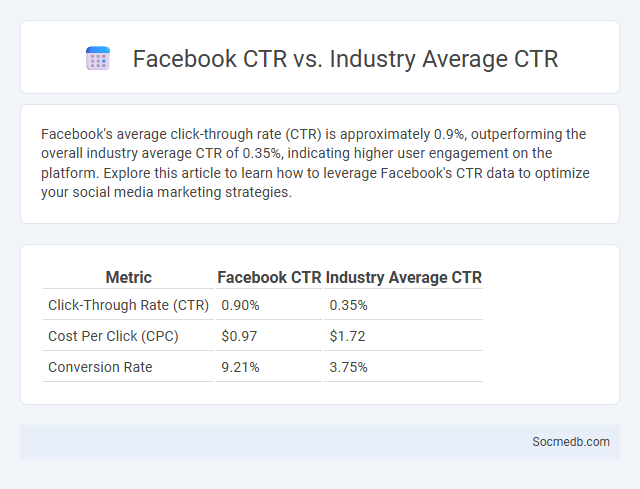
Facebook's average click-through rate (CTR) is approximately 0.9%, outperforming the overall industry average CTR of 0.35%, indicating higher user engagement on the platform. Explore this article to learn how to leverage Facebook's CTR data to optimize your social media marketing strategies.
Table of Comparison
| Metric | Facebook CTR | Industry Average CTR |
|---|---|---|
| Click-Through Rate (CTR) | 0.90% | 0.35% |
| Cost Per Click (CPC) | $0.97 | $1.72 |
| Conversion Rate | 9.21% | 3.75% |
Understanding Click-Through Rate (CTR) Basics
Click-Through Rate (CTR) measures the percentage of users who click on a social media ad or post after viewing it, indicating engagement effectiveness. A higher CTR often correlates with well-targeted content and compelling calls-to-action, which boost campaign performance. Tracking CTR helps marketers refine strategies by analyzing which messages resonate most with their audience.
What Is Facebook CTR?
Facebook CTR (Click-Through Rate) measures the percentage of users who click on your ad or post after seeing it, reflecting the effectiveness of your content in driving engagement. Understanding your Facebook CTR helps optimize ad performance by identifying which creatives and targeting strategies resonate most with your audience. Improving Your Facebook CTR increases traffic to your website or landing page, boosting conversions and maximizing ROI.
Defining Industry Average CTR
Industry average CTR (Click-Through Rate) on social media varies widely by platform, with Facebook averaging around 0.9%, Instagram approximately 0.8%, and LinkedIn maintaining about 0.39%. CTR measures the percentage of users who click on a link or ad after seeing it, reflecting the effectiveness of engagement and content relevance in marketing campaigns. Benchmarking against these averages helps businesses optimize ad strategies and allocate budgets more efficiently for improved conversion rates.
How Facebook CTR Is Calculated
Facebook CTR is calculated by dividing the number of clicks your ad receives by the total number of impressions it generates, then multiplying by 100 to express it as a percentage. This metric reflects how effectively your ad captures attention and drives engagement among viewers. Understanding your Facebook CTR helps optimize ad performance and improve targeting strategies.
Factors Influencing Facebook CTR
Facebook click-through rate (CTR) is significantly influenced by ad relevance, targeting precision, and visual appeal. High-quality images or videos combined with compelling calls-to-action enhance user engagement and increase CTR. Audience segmentation using Facebook's advanced demographic and behavioral data ensures ads reach users most likely to interact, optimizing overall campaign performance.
Comparing Facebook CTR to Industry Average CTR
Facebook's average click-through rate (CTR) typically hovers around 0.9%, which often surpasses the industry average CTR of approximately 0.35% across various digital marketing platforms. Your campaigns on Facebook can benefit from this higher engagement, translating into more efficient ad spend and improved conversion opportunities. Optimizing ad targeting and creative elements is essential to leverage Facebook's CTR advantage over the broader industry benchmark.
Why Click-Through Rate Matters in Digital Marketing
Click-through rate (CTR) is a critical metric in digital marketing because it directly measures the effectiveness of your social media campaigns in driving traffic to your website. A higher CTR indicates that your content resonates with your target audience, increasing the chances of conversions and maximizing return on investment (ROI). Understanding and optimizing your CTR helps refine ad targeting and improve overall campaign performance.
Strategies to Improve Facebook CTR
Boost Facebook CTR by crafting compelling headlines and engaging visuals that capture Your audience's attention instantly. Utilize precise targeting options to reach users most likely to interact with Your content, enhancing relevance and click propensity. Regularly test ad formats and post timings to optimize performance based on data-driven insights and user behavior patterns.
Benchmarking Your CTR Against Industry Standards
Benchmarking your click-through rate (CTR) against industry standards is essential for evaluating social media campaign performance and identifying areas for improvement. CTR varies widely across platforms, with average rates around 1.5% on Facebook, 3.1% on Instagram, and up to 2.4% on LinkedIn, making platform-specific comparisons crucial. Regular analysis of CTR metrics alongside competitors' data enables marketers to optimize ad targeting, creative content, and posting strategies to enhance engagement and conversion rates.
Key Takeaways for Optimizing Your Click-Through Rate
To optimize your click-through rate on social media, craft compelling headlines and use clear, persuasive calls to action that resonate with your target audience. Utilize high-quality visuals and videos to capture attention and increase engagement, while leveraging analytics tools to monitor performance and adjust strategies in real time. Tailoring content to user preferences and posting at peak times can significantly enhance your campaign's effectiveness and drive more traffic to your links.